Back in September, I wrote that the Kings of War tournament scene looked healthy. The argument was pretty simple: the dataset had grown, faction diversity looked strong, attendance was stable, and the tournament ecosystem was not being carried by one tiny group of diehards playing each other over and over.
That was true then. But the more interesting question is what the data says now.
Since that post, I have expanded the scene health pipeline again. This version pulls together Mantic Companion event data and KoW Masters event/player feeds, normalizes player names, aggregates everything by month, and tracks several basic measures of organized play health: unique players, event count, player entries, attendance per event, rolling averages, trailing 12-month totals, trend lines, confidence bands, and year-over-year change. (I realize that this approach underweights US participation because many tournaments don’t use the Mantic Companion. I don’t see a great source that pulls all that together, so this is what we’re stuck with for now).
The short answer is this: The Kings of War tournament scene is still much larger than it was before the post-COVID rebound, but the recent trend is clearly downward.
That is not the same as saying the game is dying. It is not even necessarily saying the community is unhealthy. It does mean the current data is more complicated than the earlier “still growing, still healthy” story.
What I Measured
For this update, I wanted to focus less on faction balance and more on tournament scene health. That means looking at questions like:
- Are more people showing up to events?
- Are more events being run?
- Is growth broad-based, or are we just seeing the same players more often?
- Is the current period actually different from the last few years?
- Are recent declines real, or just noise from incomplete data?
The main metrics are:
| Metric | What it tells us |
|---|---|
| Unique players | How many distinct normalized player names appear in a given month |
| Player entries | Total player-event rows, so one person playing two events counts twice |
| Events | Number of events recorded in the data that month |
| Attendance per event | Player entries divided by event count |
| 6-month rolling average | Smoothed monthly trend, useful because individual months are noisy |
| Trailing 12-month totals | The best view of annualized momentum |
| Year-over-year change | Whether the same month is improving or declining versus the prior year |
| Confidence bands | A sanity check on whether trend lines are statistically meaningful |
No single metric answers the question by itself. Unique players can be distorted by name matching. Event counts can be distorted by data coverage. Player entries can rise because a smaller group is playing more often. Recent months can look bad simply because not every event has posted yet.
So the goal is not to crown one magic number. The goal is to see whether the different measures are telling the same story.
Right now, they mostly are.
How the Dataset Was Built
The current pipeline combines two major sources:
- Mantic Companion event data — event metadata and player participation, pulled through the internal crawler scripts.
- KoW Masters event/player feeds — archive data and per-event results scraping.
The data is then merged into a unified event-player dataset and grouped by month.
Player names are normalized before counting unique players. That means lowercasing, Unicode normalization, quote cleanup, punctuation stripping, and whitespace cleanup. The point is to reduce obvious duplicates where the same person appears with slightly different formatting.
This helps, but it is not magic. “John Smith” and “John-Smith” should probably collapse correctly. “John Smith” and “J. Smith” may not. Nicknames, initials, spelling differences, and regional naming conventions can still create errors. Unique-player counts are only as good as the identity resolution behind them, and this is a known limitation.
For this analysis, I also capped Mantic Companion event IDs at 1300 and filtered the date range from September 2015 through the current runtime month. That avoids accidentally treating future months as zero-player declines. Across that window, the dataset currently includes:
| Measure | Current value |
| Date range | September 2015 through May 2026 |
| Months analyzed | 120 |
| All-time unique normalized players | 1,930 |
| Player-event rows | 10,898 |
| Events | 1,003 |
That is a large enough dataset to say something meaningful., though it is not perfect enough to pretend the answer is exact.
The Long-Term Picture Still Looks Good
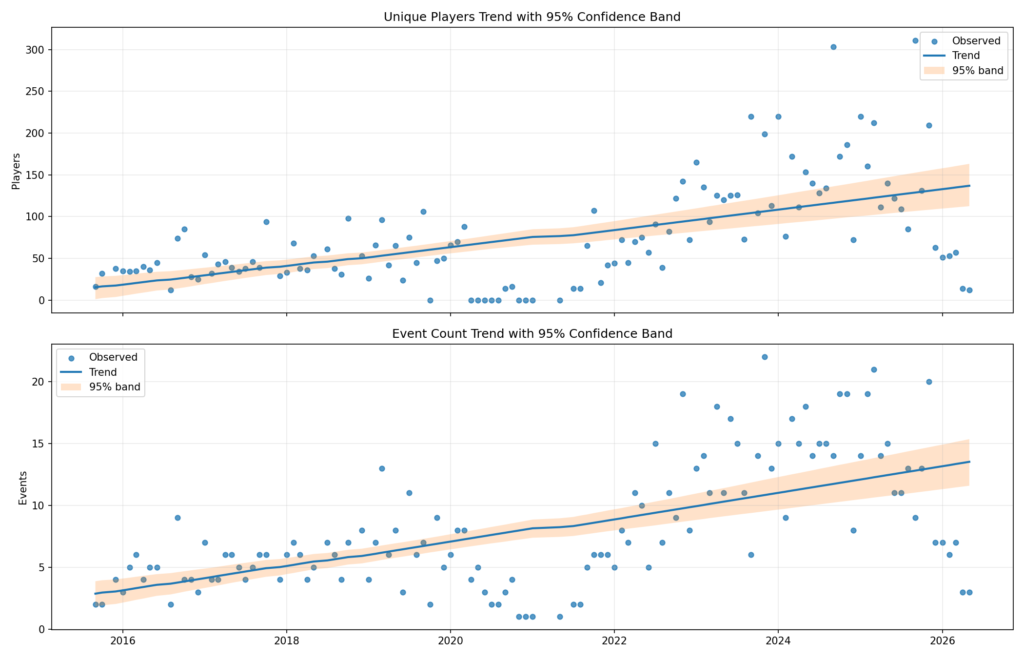
If you draw a simple trend line from 2015 to today, the scene still looks like it has grown. The full-period linear trend shows:
| Metric | Long-run monthly slope | 95% confidence interval |
| Unique players | +1.02 players/month | +0.74 to +1.34 |
| Events | +0.09 events/month | +0.07 to +0.11 |
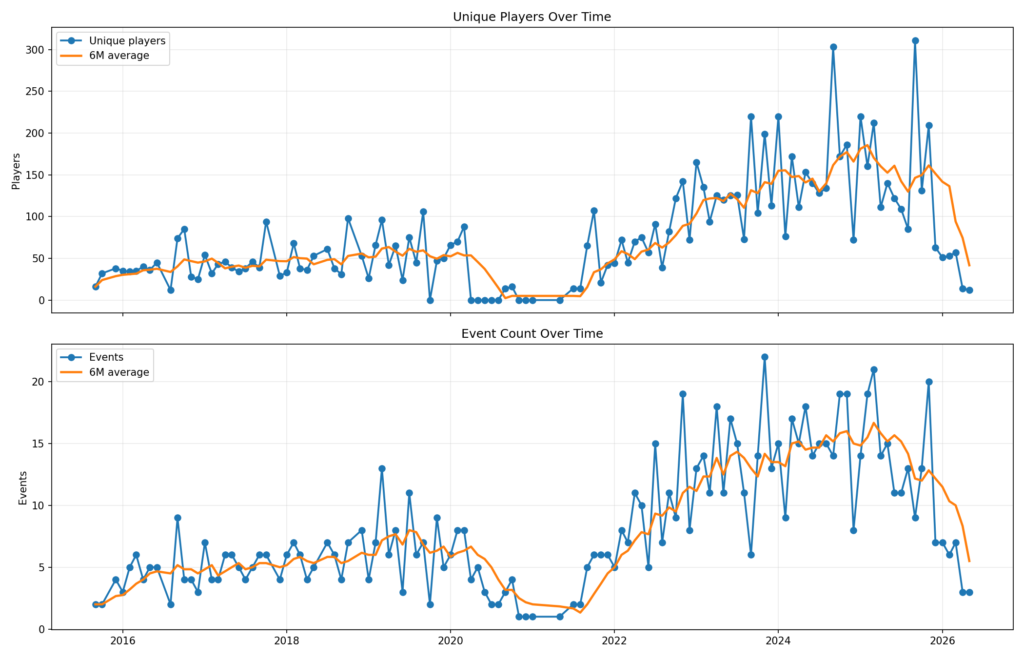
That is the big-picture case for optimism. Across the full dataset, the tournament scene is not smaller than it used to be. It is much larger than the pre-2020 baseline, and the post-COVID rebound was real. Event activity and player participation both rose sharply from the 2021 low into the 2023–2025 period.
You can see that clearly in the rolling monthly chart. The early years show a modest but real organized play base. Then COVID hits and the floor drops out. After that, the scene rebuilds, and by 2023 and 2024 the recorded tournament ecosystem is operating at a much higher level than it was before.
That part of the old article still holds up: the community did not collapse. It recovered.
But this is also where we need to be careful.
A single straight line across 2015 to 2026 is useful, but it can hide the thing we actually care about. If a scene grows for several years and then starts shrinking, a full-period trend line may still point upward. That does not mean the current trend is healthy. It just means the earlier growth was strong enough to dominate the model.
The Recent Trend Is Declining
When I shifted the health label to focus on the most recent 24 months, the picture changed. The recent 24-month slopes are negative for both unique players and event count:
| Metric | Recent 24-month slope | 95% confidence interval |
| Unique players | -5.81 players/month | -9.71 to -1.97 |
| Events | -0.49 events/month | -0.74 to -0.26 |
That is not a subtle result.
The confidence bands do not cross zero. In plain English, the model is not saying “maybe down, maybe flat.” It is saying the recent trend is downward with high confidence. That is why the current health label is declining.
This does not erase the long-run growth story. It updates it. The better version is:
The Kings of War tournament scene grew substantially after the COVID-era low, peaked around 2024–2025 in this dataset, and has shown a meaningful recent pullback, largely corresponding to the switch to 4th edition.
That is a more honest read than either “everything is fine” or “the sky is falling.”
The Trailing 12-Month View Shows the Same Pattern
The trailing 12-month charts are probably the clearest way to look at this. Monthly data is noisy. One big GT can spike unique players. One missing reporting month can make the scene look worse than it is. Trailing 12-month totals smooth that out by asking: over the last full year, how many player entries and events are we seeing? That chart shows three distinct eras:
- Pre-COVID baseline — a smaller but steady scene.
- COVID collapse — the obvious drop in organized play.
- Post-COVID surge — a sharp recovery and expansion through 2023, 2024, and into 2025.
Then comes the recent pullback. The trailing 12-month player entries peak above 2,500 and then slide down toward roughly 1,500 in the most recent view. The trailing 12-month event count follows a similar shape, peaking around 190 and dropping closer to 110. That is too large to ignore.
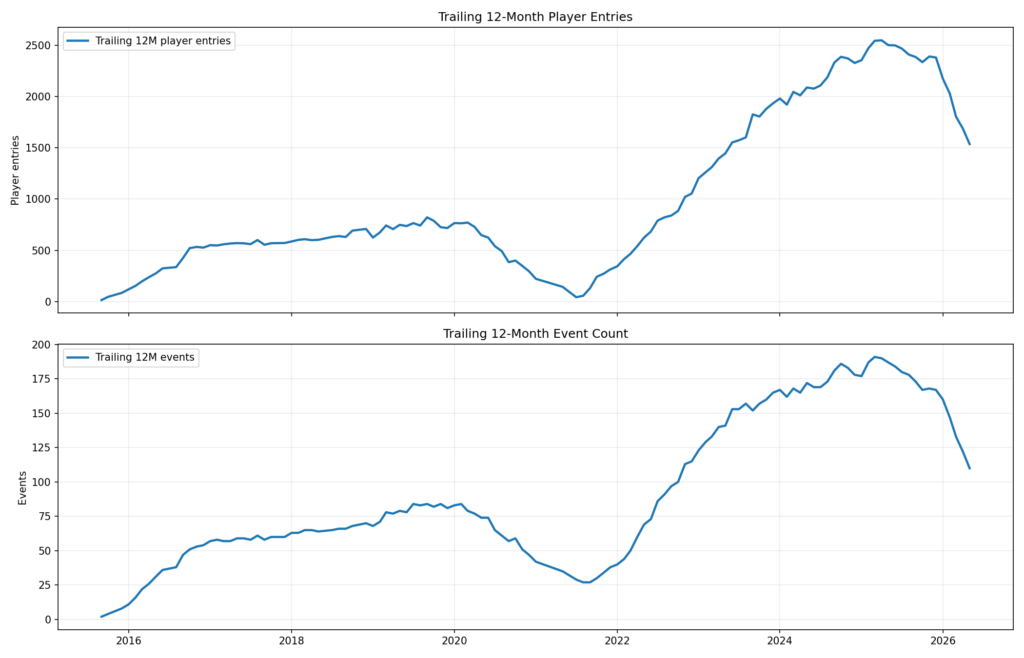
This is the chart I would put the most weight on. It is less twitchy than raw month-to-month data and less misleading than a full-period linear trend. It says the scene is not back at pre-COVID levels. Far from it. But it also says the recent peak has not held.
The 2026 Caveat Matters
There is one major caution before anyone runs to fanatics with a pitchfork (as if you need any additional encouragement . . .): The most recent months are often incomplete. Events may not be posted yet. Results may not be scraped yet. Some organizers may update late. Some sources may have coverage gaps. And because this analysis runs through the current month, the newest data points should always be treated carefully.
That is especially true for April and May 2026 in this run. Those months show very low raw values compared to the prior peak. Some of that may be real. Some may be data lag. So I would not frame this as “2026 is collapsing” based only on the last couple of monthly points. The stronger claim is this:
The slowdown is visible before the newest partial months, and the trailing 12-month metrics are already moving down.
Year-over-Year Change Is Noisy, But the Direction Has Shifted
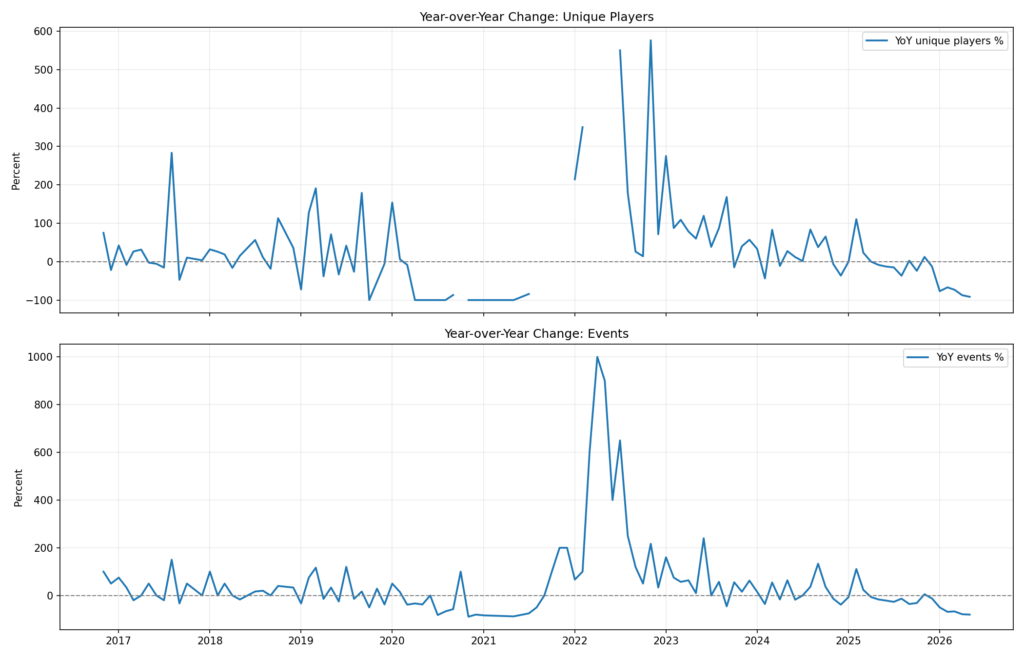
The year-over-year charts are useful, but they need a warning label. When the base month is small, percentage changes can become ridiculous. That is why the post-COVID rebound produces some giant percentage spikes. If you go from almost nothing to something, the math screams growth even when the practical meaning is more modest. Still, the later portion of the chart is useful. The recent year-over-year trend has moved from strongly positive, to mixed, to negative. That matters because it suggests we are not just seeing one bad month. We are seeing a broader deceleration from the post-COVID surge, coinciding with the switch to 4e.
Again, that does not mean the game is dying. It means the growth phase may have ended, at least for now. I would expect some falloff as people switch armies, rebase individuals, learn new rules, etc. The question becomes whether this is a normal cooling-off period after an edition switch, a data coverage issue, or an actual participation problem.
My current answer is: probably some of each.
Attendance Per Event Needs More Attention
One thing I want to dig into more is attendance per event. Event count and player count can move differently. A healthy scene could have fewer events but larger events. Or it could have more small events that grow the local base. Or it could have a shrinking number of highly committed players attending the same major events. Those are very different situations.
The current monthly data shows attendance per event can swing wildly, especially when a small number of events dominate the month. For example, September 2025 shows a large spike because recorded player entries were high relative to event count. Other recent months show much lower attendance per event. That tells me this measure is useful, but only with more careful slicing. For the next version of this analysis, I would like to separate:
- one-day events versus two-day GTs;
- regions where coverage is consistent versus regions where coverage is spotty;
- event size bands, such as 6–10, 11–20, 21–40, and 40+ players;
- repeat-player entries versus first-time or returning unique players.
That would help answer a more practical question: are we losing events, losing players, or just seeing the calendar normalize after a very active rebound period?
The Healthy Version of Concern
I do not think the useful takeaway is “panic.” The useful takeaway is “pay attention.”
If you care about the Kings of War scene, the next six to twelve months matter. Not because the game is on the edge of disaster, but because this is exactly the kind of moment where communities either stabilize or quietly lose momentum. The good news is that tournament communities are not mysterious natural forces. They are built by people doing specific things:
- running local one-day events;
- making first events less intimidating;
- posting clear event packs early;
- sharing lists and recaps;
- building regional calendars that do not cannibalize each other;
- encouraging newer players to travel;
- making the game visible outside the same few online spaces;
- treating casual and competitive players as part of the same ecosystem instead of separate tribes; and
- might I add, not being jerks or overwhelmingly doomsayers on Fanatics?
TL;DR
The last time I wrote about Kings of War community health, the data supported a pretty optimistic conclusion. The scene looked healthy, diverse, and growing. This update is more nuanced. The long-term picture is still positive. Compared to the earlier baseline, the tournament scene is much larger, and the post-COVID recovery was real. Across the full dataset, unique players and event counts both show positive long-run trends. But the recent picture is weaker. Over the most recent 24-month window, both unique players and event counts are declining, and the confidence bands suggest that decline is meaningful rather than random noise.
So the best read is not “Kings of War is dying.” It is also not “nothing to see here.” The better read is:
Kings of War organized play grew substantially, peaked in the current dataset around 2024–2025, and is now showing a real recent slowdown. The community still looks fundamentally alive, but the next year will tell us whether this is a temporary cooldown or a more serious contraction.
That is where I land for now. Still rolling dice. Still measuring. Still hoping Ronnie gives us an API someday.